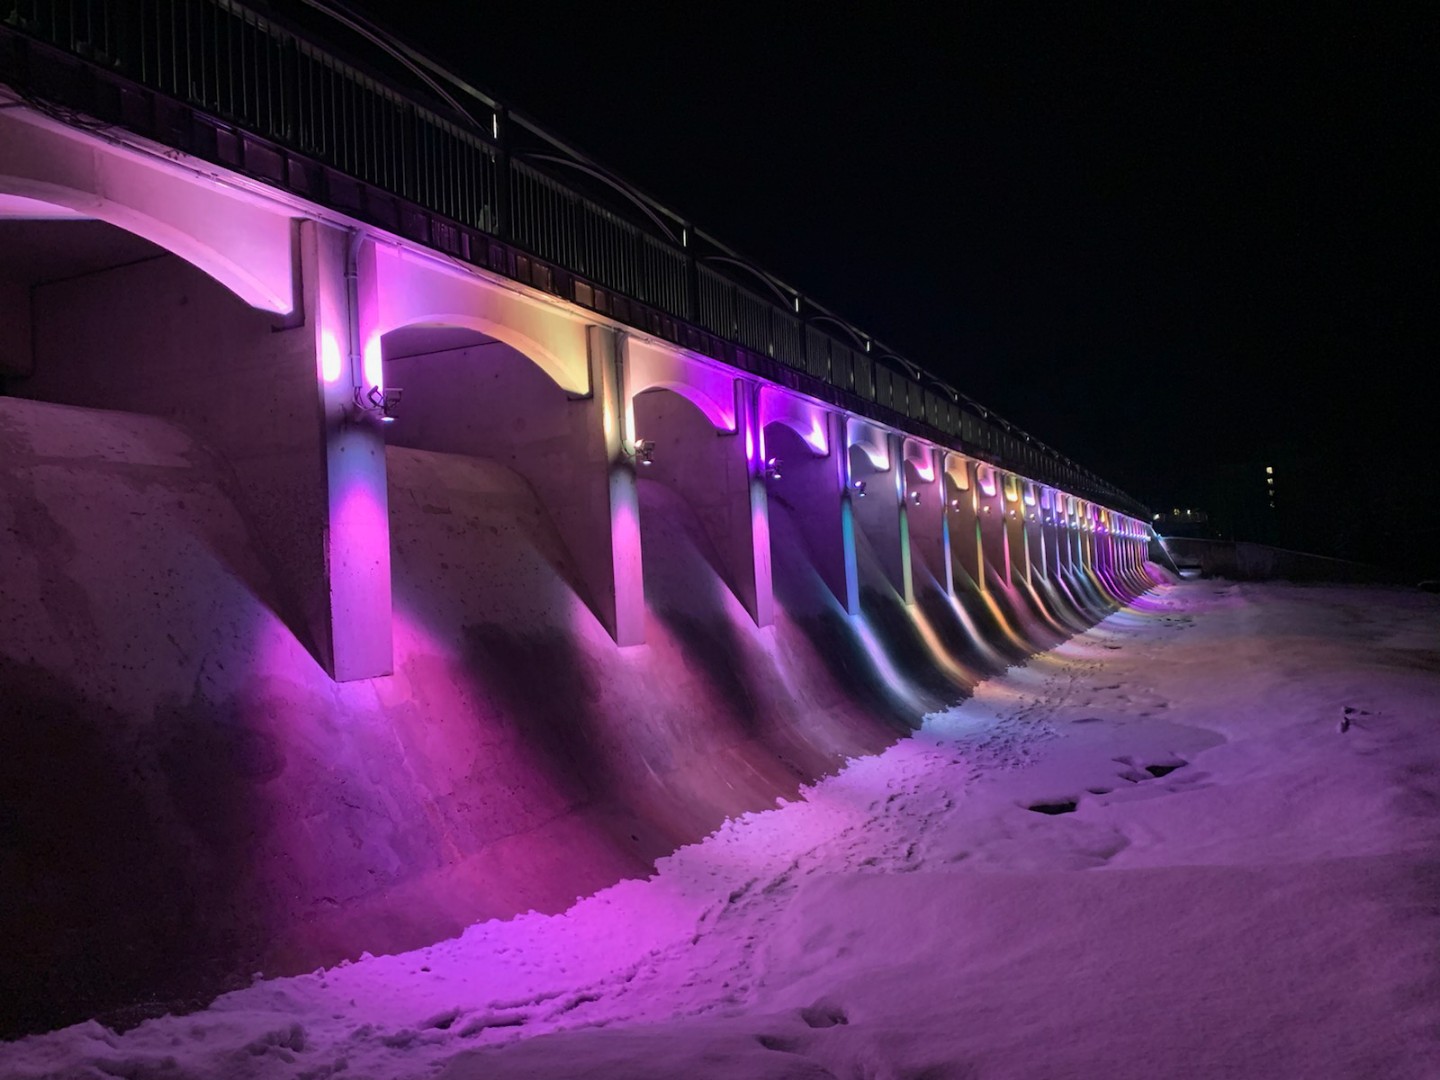
CP Rail (Dalton River) – Deformation Monitoring Survey
Methodology
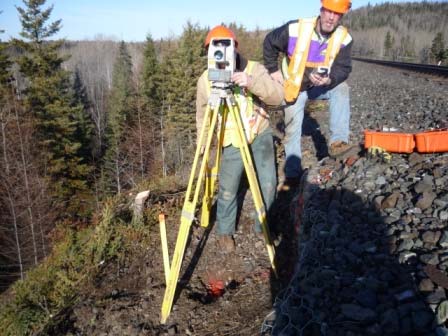
TBT Surveyors Inc. conducted a conventional deformation monitoring survey at Bridge 42.97 Dalton River to monitor potential movement in the bridge abutments and piers. The survey was conducted using conventional survey equipment including a Sokkia Set 3100 Total Station and Topcon Engineering Level with calibration verified immediately prior to survey.
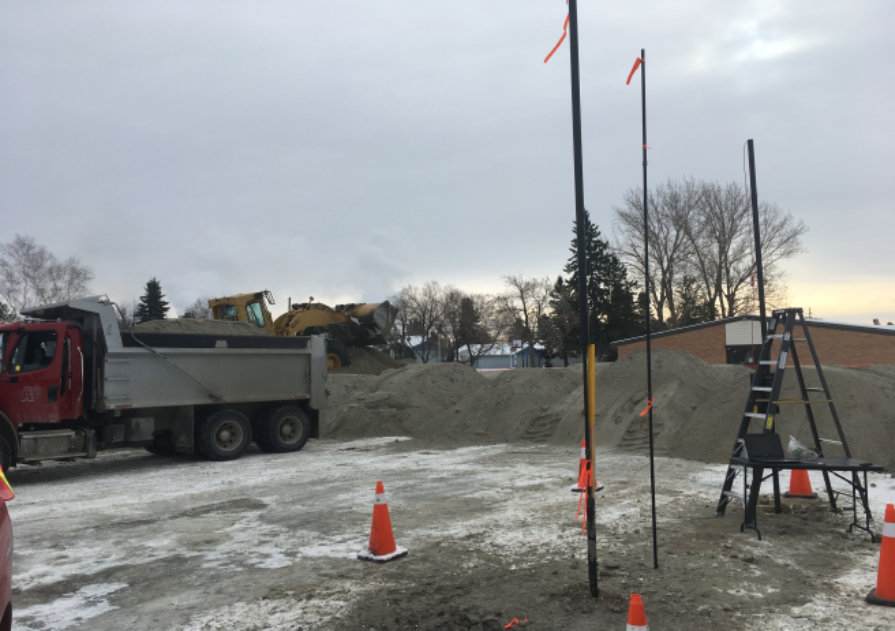
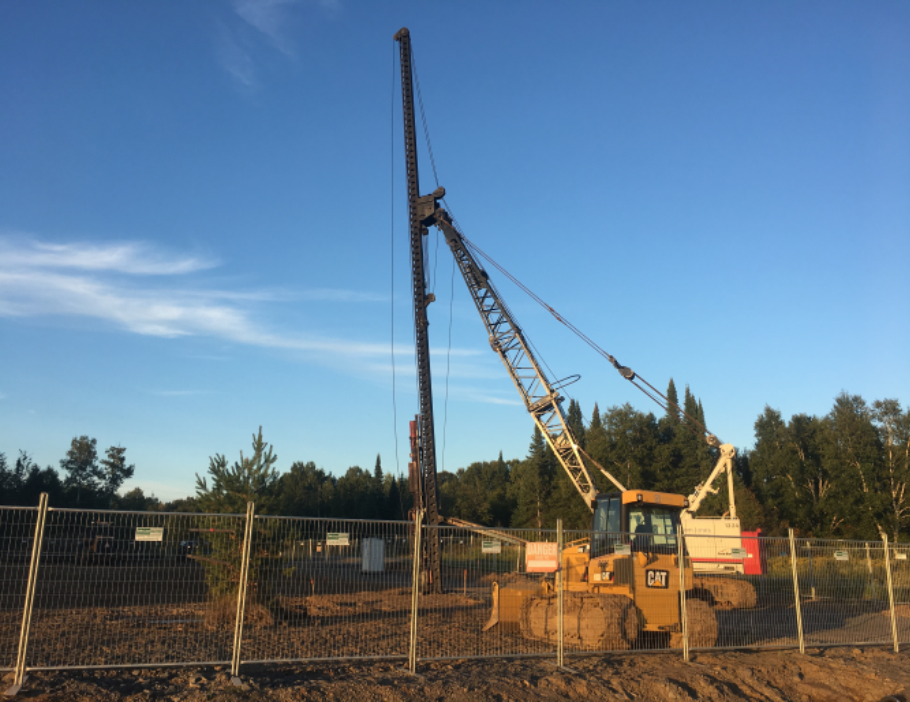
During the initial baseline survey, 4 intervisible permanent control benchmarks where installed at the site. The benchmarks where surveyed using multiple setups and were fly leveled and balanced to ensure vertical and horizontal accuracy. The control benchmarks where not installed on any part of the bridge structure and where located away from rail embankment. The control benchmarks where 1 1/2 “ diameter steel pipe that was embedded into the ground in 1.5 metre sections and coupled together until 5 metres of continuous pipe was placed or refusal was encountered.
The monitoring survey was conducted at both piers and abutments and measured both vertical and horizontal movement. Two (2) monitoring points where established at each pier and four (4) monitoring points where established at each abutment (12 monitoring points total). The survey accuracy was calibrated to less than 5 mm in both the horizontal or vertical axis. During the initial baseline survey, a survey of the track was also conducted with points taken every 2 metres along each track located on the bridge deck with additional coverage extending 10 m past bridge abutments. A survey of the steel structure below the rail ties was also conducted during the baseline survey with survey points taken every 2 metres +/- along the centre of both steel beams along bridge at gaps between rail ties.
Result Reporting
Results of the survey where provided to CP in vector diagram format showing the previous survey results, the most recent movement and the error ellipses. These forms where developed to the acceptance of CP rail and where developed in a clear concise and easily understood form. Each survey vector epoch had a different color so as to differentiate the data. If movement exceeded the error ellipse the monitoring point was considered to have moved. The subsequent movement vector was the previous measured location of the monitoring point.
The monitoring results where shown in both plan view and vertical section cut parallel with the direction of maximum average movement shown. An excel spreadsheet of the post processed point data was also included. A separate site plan of the track points and bridge structure points was developed and included profiles for each.